Resources
For students

What a Colorful World

Simplifying assumptions about “the cell” are brought into question when different strains are transformed with DNA that makes them grow in colorful ways.

OBJECTIVES

By the conclusion of this laboratory investigation, you should be able to:

  • Define and properly use synthetic biology terms: chassis, minimal cell, synthetic cell, sensor, color generator.
  • Define and properly use molecular genetics terms: operon, gene expression, bacterial transformation.
  • Explain the role of the cellular chassis in synthetic biology and engineering.
  • Conduct and interpret the results of a bacterial transformation.
  • Measure the growth of a bacterial population:
  • Bacterial Growth Curves
  • Define and properly use synthetic biology terms: Part, Open Reading Frame, iGEM

INTRODUCTION

Some Biodesign Principles

Synthetic biologists often use lab strains of E. coli because they are well understood, easy to grow and generally safe to work with, but it’s important to realize that using E. coli as a host cell for our genetic programs is a choice. This BioBuilder activity is a reminder that, just as you carefully your design for a genetic program, you also need to carefully choose the host cell, or “chassis,” that will run it. Cars are a useful analogy. Cars represent a highly engineered system of interconnected parts. Many car parts perform similar functions in different chassis, but they must be tailored to the size and function of the car they’ll run in. For instance, we might be able to move a radio from a Ford truck into a Porsche 911, but we probably can’t move the drive train or the engine.

So how are we able to move genes from one cell type to another? One trick that researchers use is to focus on strains they are familiar with, like E. coli and other domesticated cells, as chassis for experiments. In the case of E. coli, most of the strains that are used in research labs are one of two kinds. One strain is known as K-12 and the other B. Both strains are known to be safe and have been effectively used for genetic experiments for almost 100 years. The genetic differences between these strains seem to be minor. You can read more about the interesting history of these two strains.

But even small differences in these strains can trip up researchers, who often find that a genetic program works great in one chassis but will run differently in another. A key goal of synthetic biology is the reliable programming of cells, so fixing this lack of interoperability is an active area of current research. One approach to managing the complexity of the cellular chassis is to build a “minimal cell.” With this approach researchers are trying to whittle away at the existing genomes of our favorite lab organisms, leaving only the genes that the cell absolutely needs to survive. This allows researchers to precisely define the media needed to grow the minimal cell, reduces the chance of an emergent property (something unexpected that happens when you put two or more things together) and simplifies the modeling of its metabolism. Another approach to engineering a cellular chassis is to build a “synthetic cell.” This term has been used in a few ways by synthetic biologists. Sometimes a “synthetic cell” describes the replacing of one entire genome with the genome of another cell that’s been encoded by a DNA synthesizer. Sometimes a “synthetic cell” describes a “protocell” – that is a chemical mixture that do many of the things a cell can, like replicate DNA, divide etc.

About your experiment

One potential use of engineered bacteria is as indicator of toxic substances, such as arsenic or lead. Bacteria are able to grow themselves and can be very sensitive to the toxin levels. The 2009 Cambridge iGEM team wanted to design a bacterial toxin indicator that produced colors depending on the toxin detected. The team designed several color generator devices that could be linked to toxin sensors, and they called their engineered cells “E chromi.” One pigment they used is Violacein, a pigment produced by a handful of genes originally found in a different bacterial strain, Chromobacterium violacein. These genes were re-engineered and combined to produce either purple or green colors in E. coli.

To make the purple color, the team transferred to E. coli the entire violacein operon, which encodes five enzymes to metabolize L-tyrosine into a purple pigment. To vary the color, the team removed of the third gene in the operon sequence will cause the cell to metabolize the L-tyrosine into a green pigment. These pigments are easily visible to the naked eye so could be used to make a biosensor that turns color in response to toxins.

So now imagine that a group of engineers is manufacturing an arsenic sensor in E. coli. This group would like the intensity of purple color to vary as a function of arsenic level. Now imagine that a second group of engineers are also doing this but they use a different strain of E. coli. How sure can we be that the pigment will be expressed the same in a different chassis? Thinking back to our analogy with car chassis: would an engineer put a V-8 engine from a Lexus into a Mercedes chassis? Would the engine behave the same? Would the car?

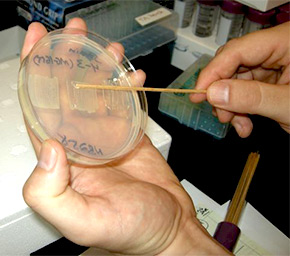
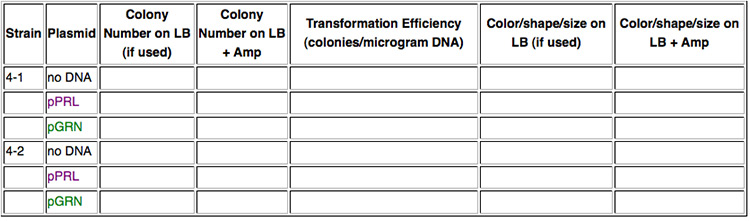
In this lab you will transform bacteria from two different strains of E. coli, in other words, two different chassis. Strain 4-1 is a K-12 strain, while strain 4-2 is a B-type strain. Into each strain you will insert plasmids containing violacein-pigment devices. One plasmid, pPRL, has the purple version of this device while the other plasmid, pGRN, has the dark green version. Otherwise, the plasmids are the same. Can we expect the devices to behave the same in each strain or will the chassis have an effect on the intensity of color produced?

PART 1

PREPARING STRAIN 4-1 AND 4-2 FOR TRANSFORMATION
scraping cells off petri dish
Scraping cells off petri dish to transform them.

Neither of these E. coli strains will take up DNA from the environment until they are treated with a salt solution that makes their outer membrane slightly porous. The cells will become “competent” for transformation (i.e. ready to bring DNA that’s external to the cell into the cytoplasm where the DNA code can be expressed). The cells will also become fragile. Keep the cells cold and don’t pipet them roughly once you have swirled them into the CaCl2 salt solution.

  1. In advance of lab today, a small patch of each strain was grown for you on an LB agar petri dish. Watch how we prepared the cells:
  2. Patching Strains
  3. Label 2 small eppendorf tubes either “4-1” or “4-2”.
  4. Pipet 200 ul of CaCl2 solution into each eppendorf and then place the tubes on ice.
  5. Use a sterile wooden dowel or inoculating loop to scrape up one entire patch of cells (NOT including the agar that they’re growing on!) labeled “4-1,” and then swirl the cells into its tube of cold CaCl2. A small bit of agar can get transferred without consequence to your experiment, but remember you’re trying to move the cells to the CaCl2, not the media they’re growing on. If you have a vortex, you can resuspend the cells by vortexing very briefly. If no vortex is available, gently flick and invert the eppendorf tube, then return it to your icebucket.
  6. Repeat, using a different sterile wooden dowel to scrape up the patch of cells labeled “4-2.” Vortex briefly if possible. It’s OK for some clumps of cells to remain in this solution.
  7. Keep these competent cells on ice while you prepare the DNA for transformation.

PART 2

TRANSFORMING STRAINS 4-1 AND 4-2 WITH PPRL AND PGRN

The cells you’ve prepared will be enough to complete a total of 6 transformations. You will transform the purple-color generator into each strain, and also the green-color generator into each strain. You will also use the last bit of competent cells as negative controls for the transformation.


  1. Retrieve 2 aliquots of each plasmid for a total of 4 samples (2x pPRL, 2x pGRN). Each aliquot has 5 ul of DNA in it. The DNA is at a concentration of 0.04 ug/ul. You will need these values when you calculate the transformation efficiency at the end of this experiment.
  2. Label one of the pPRL tubes “4-1.” Label the other pPRL tube “4-2.” Be sure that the labels are readable. Place the tubes in the ice bucket.
  3. Label one of the pGRN tubes “4-1.” Label the other pGRN tube “4-2.” Be sure that the labels are readable. Place the tubes in the ice bucket.
  4. Flick the tube with the competent 4-1 strain and then pipet 100 ul of the bacteria into the tube labeled “pPRL, 4-1” and an additional 100 ul into the tube labeled “pGRN, 4-1.” Flick to mix the tubes and return them to the ice. Save the remaining small volume of the 4-1 strain on ice.
  5. Flick the tube with the competent 4-2 strain and then pipet 100 ul into the tube labeled “pPRL, 4-2” and an additional 100 ul into the tube labeled “pGRN, 4-2.” Flick to mix and store them, as well as the remaining volume of competent cells, on ice.
  6. Let the DNA and the cells sit on ice for 5 minutes. Use a timer to count down the time.
  7. While your DNA and cells are incubating, you can label the bottoms (not the tops) of the 6 petri dishes you’ll need. The label should indicate the strain you’ve used (“4-1” or “4-2”) and the DNA you’ve transformed them with (“pPRL,” “pGRN,” or “no DNA control”)
  8. Heat shock all of your DNA/cell samples by placing the tubes at 42° for 90 seconds exactly (use a timer). This step helps drive the DNA into the cells and closes the porous bacterial membranes of the bacteria.
  9. At the end of the 90 seconds, move the tubes to a rack at room temperature.
  10. Add 0.5 ml of room temperature LB to the tubes. Close the caps, and invert the tubes to mix the contents.
  11. Using a sterilized spreader or sterile beads, spread 200 or 250 ul of the transformation mixes onto the surface of LB+ampicillin agar petri dishes.
  12. If desired the remaining volumes of transformation mixes can be plated on LB plates to show the effect of antibiotic selection on the outcome.
  13. Incubate the petri dishes with the agar side up at 37° overnight, not more than 24 hours.

DATA COLLECTION AND ANALYSIS

In your lab notebook, you will need to construct a data table as shown below for each of the samples.

In your lab notebook, you will need to construct a data table as shown below. These may be provided.

Colorful World Data Table
    1. Count the number of colonies growing on each petri dish.
      • Small white colonies that are growing around the perimeter of larger colored colonies are called “satellites.” They should not be counted. They grow near the central colony only after the cells there have inactivated the ampicillin that’s in the petri dish agar.
      • You can feel most confident in your results if there are between 20 and 200 colonies on the petri dish. Fewer than 20 and your value is affected by errors in pipeting that make large percentage differences in the outcome. Greater than 200 colonies and they become hard to count reliably. If the petri dish has many colonies growing on it, try to divide the dish into pie sections (1/4th or 1/8ths or even 1/16ths of the area), and then count a representative area. Finally, multiply the number you get for the section to get your total number of colonies. You’ll still have some counting error, but perhaps less.
      • Based on the number of colonies you find on each petri dish, calculate the transformation efficiency for each. Transformation efficiency is a measure for how well the cells incorporated the DNA. The units for transformation efficiency are “colonies per microgram of DNA.” Each transformation used 200 nanograms (=0.2 micrograms) of DNA and you plated only 1/2 the transformation mixes on the petri dishes.
    2. Record the color of the colonies you see
      • Based on these observations, do the DNA programs seems to be behaving identically in both strains for E. coli? For example, does the pPRL plasmid give the same number of transformants and the same color in both strains? What about the pGRN plasmid? If you see differences, how can you explain them? How could you test your explanations?

Calculations

Here is a sample calculation for transformation efficiency

Data:

      • 100 colonies on a petri dish
      • 0.2 micrograms of DNA used
      • 1/2 of the transformation mix plated

Calculation:

    • 100 x 2 = 200 colonies if all were plated
    • 200 colonies/0.2 micrograms of DNA = 1*10^3 colonies/microgram of DNA = transformation efficiency

LAB REPORT

  1. Introduction
    • Provide a brief introduction describing the field of synthetic biology.
    • What is a color generator? How does this color generator work? How might a color generator be useful?
    • Briefly describe the purpose of the lab. What are we trying to do here? Presume that a reader of your lab report has not read the assignment.
    • What is the role of the chassis?
    • How does chassis effect the expression of a genetic system?
    • How might synthetic engineers modify the relation between a chassis and an engineered genetic system to reduce the chassis effect on the system?
    • Why is it important to engineer a minimal or synthetic cell?
    • What are the advantages/concerns of engineering a minimal cell?
    • How might we test for the differences in the chassis that may be affecting a genetic system? You may find helpful information here and here.
  2. Methods
    • You do not have to rewrite the procedure.
    • Explain why you did each step of the protocol.
  3. Results
    • Present the data tables in clear format.
    • Present drawings of each slide.
    • Describe the results: Describe the appearance of each plate. Are the colors different? Are the colonies different in number, size and/or shape? What was the transformation efficiency for each plate? Does it differ between the strains?
  4. Discussion
    • Draw a conclusion: Do the color generators produce the same results in different chassis? Justify your answer.
    • Analyze the data: Be sure to discuss how each part of the experiment and results adds to your conclusion.
    • Are we sure that the transformation worked? What do the controls that lacked plasmid tell us?
    • Discuss errors and other reasons for data variability.
    • Use your results to explain why it is important for synthetic biologists to fully characterize the chassis used in an engineered system.